Analyzing trends in data is an important aspect of environmental monitoring for facilities.
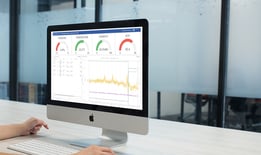
Many tools and methods exist for trending environmental monitoring data. For data to be useful to staff, it should be gathered with the intention of being collected and analyzed to meet the needs of the facility. Both graphs and tables, whether generated manually or by software, can provide visualization of the data. Programs like Microsoft Excel can be used to perform data trending manually. However, Setra CEMS is an intuitive, user friendly software solution that provides built-in data visualization tools for trending analysis. Setra CEMS collects real-time data from in-room sensors and provides actionable information and feedback to users. In addition to data visualization and alarm notifications, CEMS stores alarm events and audit logs for compliance reporting.
Best Practices and Resources
When putting environmental monitoring in place, limits for notifications and alarm events must be established. Sources for guidelines on what limits to set include the EMEA Guidelines to Good Manufacturing Practice: Annex 1 and ISO 14464-1.
Historical data is a necessity when creating alert levels for environmental monitoring. Historical data means limits are established in away that provides a useful view of the facility. Any limits set should be reviewed yearly at a minimum.
Environmental monitoring trend reports should include information such as:
- Room classifications
- Graphs of trend data
- Indication of deviations or excursions
Continuous review of environmental monitoring trend data and deviation limits is recommended for maintaining the safety of the facility. The frequency of trending data will depend on both the type of facility and the amount of data collected.
