The accuracy of differential pressure transducers has greatly improved to provide better solutions for demanding applications. This article discusses why accuracy is an important consideration when selecting a pressure transducer for low-differential, critical pressure applications.
Output readings are extremely accurate, down to or below +0.07% FS RSS (Full scale, Root Sum Squared method), as capacitance transducer suppliers reduce noise influence and utilize digital linearization processes. These sensors use a frequency signal output from the sensor instead of an analog signal, which at the 20-40 MHz range reduce the conducted noise entering the circuit. These high frequency signals are easily and precisely measured and “digital ready” for conditioning through digital signal processing.
The accuracy of a pressure transducer is traditionally quantified by the root sum square (RSS) method:
![]()
Better accuracy (a lower % FS) is achieved when each of the three values are as small as possible. The three characteristics of the accuracy calculation are show in Diagrams 4-6. Non-repeatability and hysteresis are inherent in the design of the sensing element and are difficult to compensate for during the manufacturing process. Often these values are indicators of the basic quality and stability of the sensor. What is compensated for during the calibration process is non-linearity.
 Diagram 1: Effects of Non-Repeatability and Hysteresis on a Pressure Transducer output
The best fit straight line (BFSL or BSL) method of calculating non-linearity fits a straight line through the actual curve in order to minimize the relative error between the actual curve and the straight line. In this case, the end points of the curve have no meaningful relationship to the best fit straight line.
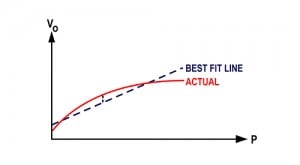 Diagram 2: How Non-Linearity is measured with best fit straight line method
A more accurate and stringent method of calculating non-linearity is the end point method (Diagram 6), which measures the non-linearity when a straight line is drawn connecting the end points from P0 (zero differential pressure) to PFS (full scale). In this case, the end-point accuracy is preserved when calibration adjustments are made to zero offset or span. The different methods of measuring non-linearity have an effect on how RSS sensor accuracy is reported. For example, a sensor with a ±0.03% non-linearity with the endpoint method could have a ±0.015% non-linearity with the best fit straight line method. The lower non-linearity number for the BSFL method does not result in improved accuracy.
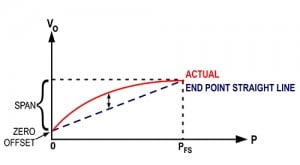 Diagram 3: How Non-Linearity is measured with stricter endpoint method
During the manufacturing process, the transducer performs all digital processing to linearize the output signal. Digital signal linearization is accomplished more exactly than is possible with analog signal linearization. The result is real-time, accurate and reliable data about the state of the monitored process. In addition, digital processing provides a higher degree of immunity from electrical noise than analog processing can offer.
CLICK HERE to learn more about Setra's pressure transducers.
